A Surprising Truth: Most Traders Fail Without Proper Stock Market Analysis Software
“Did you know that 90% of stock traders lose money, often due to ineffective or misunderstood analysis tools?”
Many investors jump into trading hoping for quick gains, only to realize that intuition and basic charts aren’t enough. Without robust stock market analysis software, traders lack access to real time price data, customizable charting tools, and integrated technical indicators—key assets for making informed trading decisions. The truth is, sophisticated technical analysis tools have become essential for everyone, from casual investors to experienced traders, as the markets grow more complex and competitive. When you don’t have proper software, you’re left guessing about entry and exit points, misreading financial data, or missing out on new trade ideas entirely.
Investing without a reliable stock analysis platform puts you at a disadvantage—especially when others are leveraging advanced charting software, automated alert systems, and powerful stock screeners. If you’ve ever found yourself confused by market data or paralyzed by conflicting indicators, it’s likely you’re not using the right analysis tool for your trading style. Solving these common problems starts with understanding what leading charting and analysis tools offer, and how to match them to your needs for actionable insights and better trade execution.
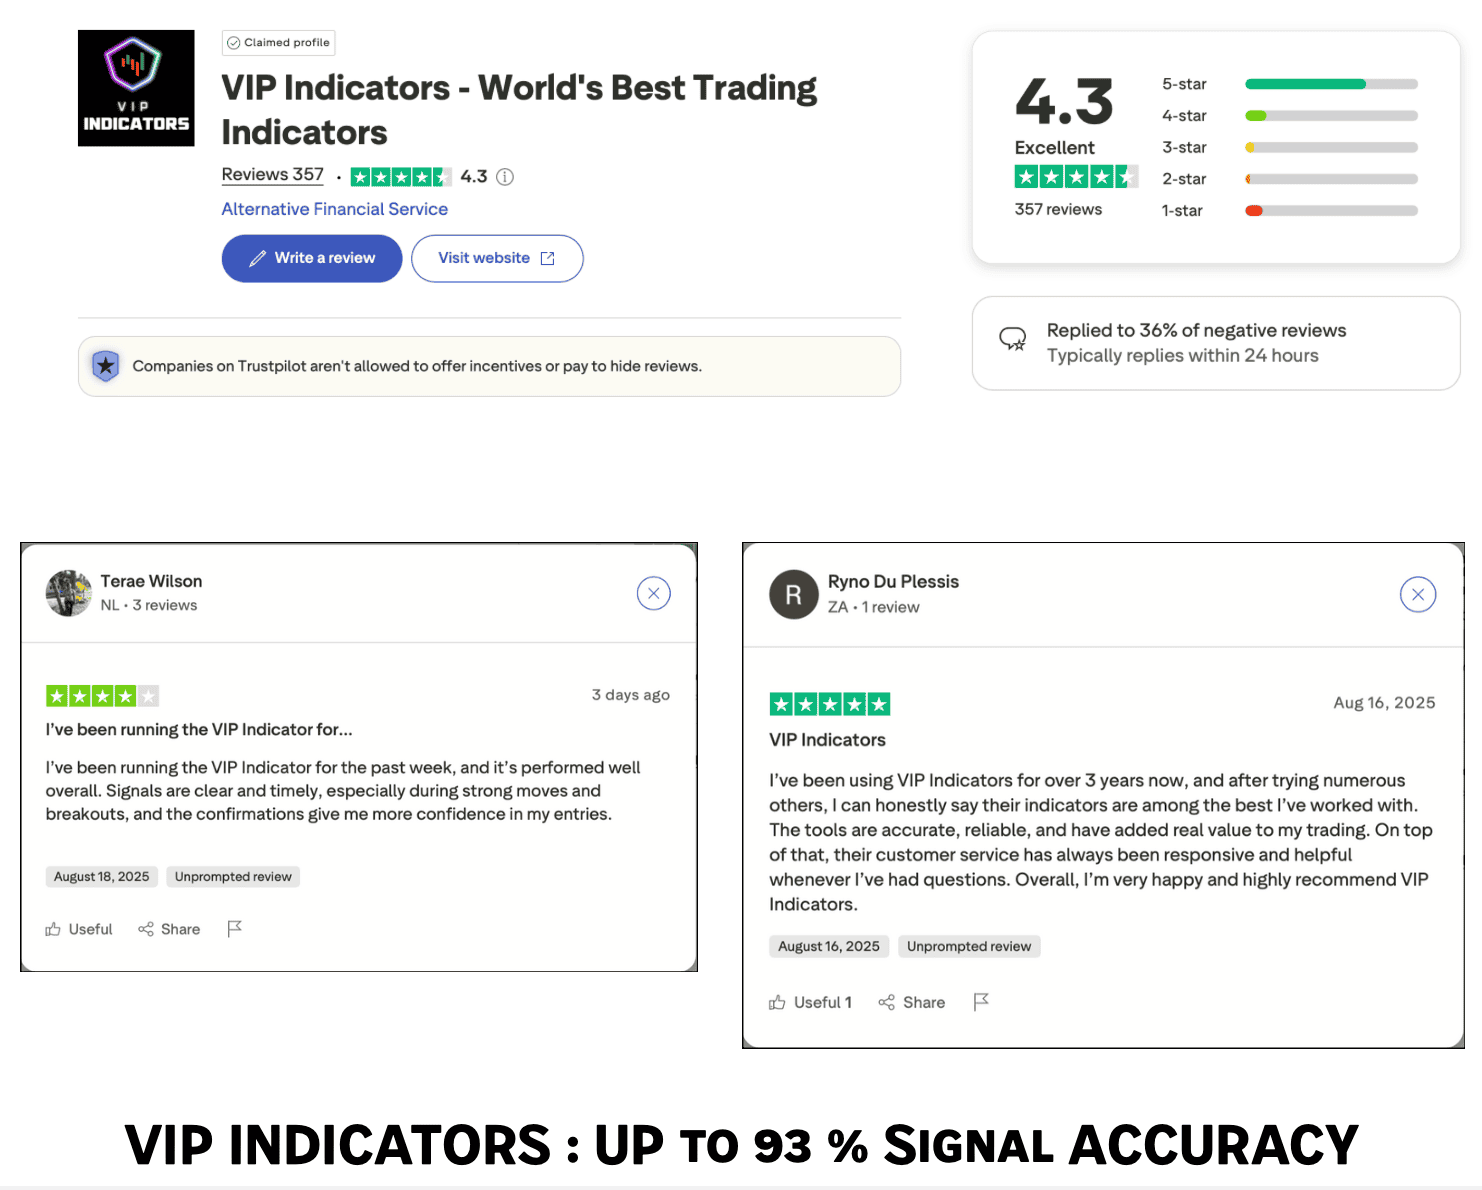
ADVERTISEMENT SECTION : VIP INDICATORS

What You’ll Learn About Stock Market Analysis Software
- How to identify essential features in stock market analysis software
- A comparison of leading charting platforms and technical analysis tools
- Tips to align software choice with trading style and strategies
- Real-user insights and expert advice for optimizing your stock analysis
Ranking the Top 10 Stock Market Analysis Software Solutions
- MetaStock: The Classic Charting Software and Technical Analysis Tool
- TradingView: Social Charting Platform for Next-Gen Traders
- Trade Ideas: AI-Powered Trade Idea Generation and Analysis Tools
- Yahoo Finance: Reliable Market Data and Stock Screeners
- Thinkorswim by TD Ameritrade: Advanced Technical Analysis Features
- TrendSpider: Automated Charting Tools and Technical Analysis
- Stock Rover: Comprehensive Stock Analysis and Screener
- EquityStat: Portfolio Tracking and Fundamental Analysis
- WeBull: Accessible Stock Analysis Tool With Free Real-Time Data
- NinjaTrader: Advanced Market Analysis Software for Active Traders

Key Features to Look For in Stock Market Analysis Software
When searching for the best stock market analysis software, it’s important to prioritize features that support both your trading style and long-term goals. A powerful analysis tool should strike a balance between real-time market data integration—to ensure your decisions are made on the latest price data—and advanced charting tools, which visualize trends clearly. Look for platforms that offer deep technical analysis capabilities, such as a variety of indicators, customizable drawing tools, and backtesting for your strategies. Equally vital is user customization, so you can adapt the dashboard or watchlist according to your workflow and experience level.
- Real-Time Market Data Integration
- Advanced Charting Tools and Platforms
- In-Depth Technical Analysis Capabilities
- User Customization and Trading Strategy Support
- Integrated News and Research Modules
- Mobile Compatibility for Analysis on the Go
Stock Market Analysis Software: How to Choose for Your Trading Style
Selecting the right stock market analysis software isn’t just about features—it’s about compatibility with your unique trading style. Day traders, for instance, require real time data feeds, fast execution, and high-powered charting tools, while long-term investors lean on in-depth research, strong portfolio features, and historical data for trend spotting. Ask yourself whether a platform’s analysis tools improve your ability to generate trade ideas and manage risk, or if you’re overwhelmed by bells and whistles that don’t fit your process.
To find the optimal software, consider how you approach the market each day. Do you monitor multiple stocks for quick patterns, or study long-term trends with technical and fundamental analysis? The feature set and workflow of your chosen platform must complement—not complicate—your preferred strategy. By identifying your priorities, you’ll avoid decision fatigue and make the most out of advanced features like stock screeners, automated alerts, and customizable chart layouts.
Day Trading vs. Long-Term Investment: Choosing the Right Trading Platform
If you’re a day trader, speed and real-time access are everything. You’ll want a trading platform with lightning-fast data updates, integrated news, customizable technical indicators, and robust charting tools. Examples like Trade Ideas and Thinkorswim excel in these areas, catering to active traders who thrive on rapid movement, advanced chart overlays, and market scans to spot fleeting opportunities. Reliable alerts, pattern recognition, and advanced technical features are non-negotiable for this trading style, as hesitation can mean missed profits or unexpected losses.
By contrast, investors who seek to hold stocks for weeks or years will value platforms with powerful fundamental screeners, portfolio management tools, and comprehensive research modules (think Stock Rover or Yahoo Finance). These users focus more on financial data, trend analysis over longer periods, and robust watchlists with alert capabilities. Ultimately, aligning your software to your style delivers confidence, speed, and clarity at every stage of the trade.

Aligning Technical Analysis Tools with Your Trading Strategies
The effectiveness of technical analysis tools depends largely on how well they sync with your established trading strategies. For example, a technical indicator-heavy platform may benefit a trend follower, but could overwhelm a fundamentals-oriented value investor. Look for platforms that allow you to customize indicator sets, automate backtesting, and overlay historical data as needed. The best charting software will let you visualize trade ideas easily—whether that means candlestick patterns for timing entries or complex technical overlays for confirming signals.
Consider whether your platform integrates not just indicators, but also automated alerts, community insights, and a flexible interface to tweak chart layouts. Social features, as found on TradingView, allow traders to test new ideas and receive feedback on strategies, making the learning curve less steep and the development of your trading edge more collaborative. Your software isn’t just a tool; it should become the backbone of a repeatable system for trade execution and risk management.
Comparing Industry Leaders: Charting Platforms and Analysis Tools Table
| Software | Charting Tools | Technical Analysis | Stock Screener | Market Data | Mobile App |
|---|---|---|---|---|---|
| MetaStock | Yes | Advanced | Yes | Real-time | No |
| TradingView | Yes | Yes | Yes | Yes | Yes |
| Trade Ideas | Yes | Yes | AI-driven | Yes | Yes |
| Yahoo Finance | Basic | Basic | Yes | Yes | Yes |
Expert Quote: Why Choosing the Right Charting Software Matters
“The best stock market analysis software is not just about data, but about transforming raw numbers into actionable insights for your unique trading style.”
Best Technical Analysis Tools for Stock Market Success
- MetaStock: Comprehensive Charting and Indicator Library
- TrendSpider: Automated Technical Analysis Tool
- TradingView: User-Friendly Charting Software with Community Features
- Trade Ideas: Algorithm-Driven Trade Ideas and Market Scans

Integrating Stock Market Analysis Software with Trading Strategies
Developing Profitable Trade Ideas Using Analysis Tools
The true power of stock market analysis software emerges when it’s deeply integrated with your unique trading strategies. Today’s leading analysis tools provide intelligent trade ideas, backtesting capabilities, and market scans based on both technical and fundamental factors. Some platforms offer AI-driven suggestions, while others prioritize customizable filters and drawing tools for deeper strategy development. Effective integration means using automated alerts, generated from your chosen technical indicators, to act quickly on trade opportunities as they arise.
A solid analysis tool should not only highlight potential trades, but also help you validate those trade ideas using historical data, price movement patterns, and real time news. By combining the strength of technical analysis with innovation in automated workflows and community-driven insights, you can turn a flood of financial data into actionable decisions—gaining an edge over traders who still rely on intuition or guesswork alone.
Real-Time Market Data: The Fuel for Effective Stock Analysis
Without real-time market data, even the most sophisticated technical analysis becomes obsolete. Timely and accurate price feeds power the visualizations, indicators, and alerts within your charting platform. Modern stock market analysis software like MetaStock and TradingView ensure that traders are always one step ahead by instantly reflecting changes in the financial markets. Having access to precise, up-to-the-moment data prevents delayed reactions to market volatility, letting traders execute their strategies at optimal moments.
Additionally, blending market data with historical datasets lets traders apply advanced technical analysis and recognize patterns that inform their trade ideas. For active traders, latency or interruptions in data feeds can significantly impact outcomes, making the reliability of your chosen analysis tool a non-negotiable feature. The best platforms also provide news and research modules that integrate with technical and fundamental screens, helping you capture both short-term price action and long-term trends.
Free vs. Paid Stock Market Analysis Software: Which Is Right For You?
The decision between free version and paid stock market analysis software depends on your needs, trading style, and depth of analysis required. Free tools, such as Yahoo Finance and basic TradingView accounts, offer accessible entry points and basic charting tools for beginners. However, advanced traders often find these solutions limiting—particularly in areas like real-time market data, automated alerts, or in-depth technical analysis. Paid platforms, though requiring a subscription, deliver advanced features, robust backtesting, and high customization options to support active traders and experienced investors.
Ultimately, evaluate the feature set against your goals. Some platforms offer generous free trials so new users can test charting platforms, stock screeners, and trade idea generation before committing to a purchase or subscription. The right balance can mean the difference between a tool that barely aids your workflow and a daily edge that makes you a more confident, efficient trader.
Pros and Cons Table: Free vs. Paid Analysis Tools
| Type | Strengths | Weaknesses |
|---|---|---|
| Free | Accessible, Basic Tools, No Cost | Limited Data, Fewer Features |
| Paid | Advanced Features, Reliable Data, More Customization | Subscription Cost |
How Stock Market Analysis Software Improves Trade Idea Generation
- Automated alerts for price movement
- Backtesting trading strategies quickly
- Identifying trade opportunities through screeners
- Integrating diverse sources of financial news

Popular Charting Software: A Closer Look at MetaStock, TradingView, and Yahoo Finance
MetaStock: Legacy Technical Analysis Tools for Professionals
MetaStock is renowned for its depth and breadth in technical analysis, offering an extensive indicator library, advanced charting capabilities, and powerful backtesting for seasoned traders. Suited for professionals and active traders, MetaStock shines in developing and validating complex trading strategies thanks to its customizable analysis tool features and robust real-time data coverage. While lacking a native mobile app, MetaStock’s desktop interface provides unparalleled technical detail—making it a staple among market veterans seeking a traditional, reliable solution.
The platform’s focus on advanced technical analysis tools means it’s a top choice for those who prioritize heavy indicator use, algorithm-driven market scans, and meticulous study of price data. MetaStock users appreciate its multi-window layout, support for custom formulas, and comprehensive historical data. However, beginners may find the interface dense, as it’s built with experienced, detail-oriented traders in mind.
TradingView: Social Charting Platform for Collaborative Analysis
TradingView stands out as a versatile charting platform that excels in user-friendliness and community-driven insights. Its web-based interface makes it accessible anywhere, with a full suite of charting tools including trend lines, candlestick patterns, and a variety of technical indicators. The social element allows users to share trade ideas, follow strategies, and receive real-time feedback from other traders, turning analysis into a collaborative experience.
Accessible via both desktop and mobile apps, TradingView merges convenience with innovation for all trader levels. It delivers reliable market data, robust drawing tools, and an intuitive layout, making advanced technical analysis approachable for beginners and professionals alike. Regular updates, integrated news, and the flexibility of plugins and add-ons further cement TradingView’s position as a progressive tool for modern traders.
Yahoo Finance: Free Market Data and User-Friendly Analysis Tools
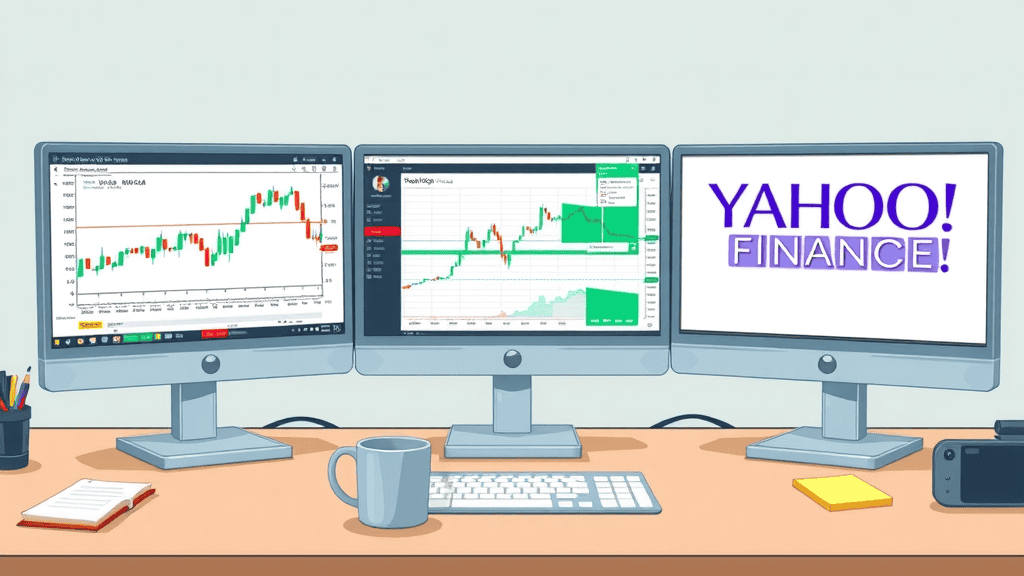
Yahoo Finance is a well-known entry point for new investors, offering free access to price data, basic charting software, and reliable market news. While its technical analysis features are less sophisticated compared to MetaStock or TradingView, Yahoo Finance is unmatched in accessibility and ease of use. It’s ideal for those prioritizing simple stock screening, historical data review, and quick trend analysis with minimal learning curve.
The platform makes it easy to build watchlists, set up basic alerts, and explore financial data from countless stocks globally. Its mobile app and integration with financial news deliver timely updates on market trends, earning Yahoo Finance a spot in most beginner’s toolkits—or a handy secondary source for more experienced traders seeking fast, convenient overviews.

User Experience: What Real Traders Say About Their Stock Analysis Tools
“Switching to a more intuitive stock market analysis software improved both my efficiency and confidence in trade execution.”
Many real traders echo the sentiment that the right platform transforms not only their analysis process but also their trading psychology. Upgrading to modern analysis tools, with customizable charting software and fast, actionable alerts, has empowered users to act quickly on trade ideas, minimize errors, and make fully informed decisions. The difference is especially pronounced after moving from free, basic charting tools to platforms offering advanced technical indicators, comprehensive stock screeners, and seamless integration with trading accounts.
User testimonials frequently cite the ease of sharing strategies and receiving community feedback on TradingView, or the confident decision-making enabled by MetaStock’s powerful backtesting suite. In all cases, matching the software’s strengths to the trader’s workflow and style is crucial for lasting success.
Essential Stock Screener Features for In-Depth Stock Market Analysis
- Price, volume, and market cap filtering
- Fundamental and technical filter options
- Watchlist creation and alert systems
- Custom formula integration

The Role of Charting Tools in Technical Analysis
- Candlestick patterns identification
- Drawing support/resistance lines
- Using technical indicators like RSI and MACD
- Overlaying market trends to inform entry and exit decisions

Security and Integration: Protecting Your Data with Stock Market Analysis Software
- Two-factor authentication
- Data encryption
- API compatibility with trading platforms
- Regular software updates
People Also Ask: Answering Top Questions About Stock Market Analysis Software
What is the best software to analyse the stock market?
Leading stock market analysis software such as MetaStock, TradingView, and Thinkorswim offer robust charting tools, advanced technical analysis capabilities, and reliable market data. The ‘best’ will depend on individual trading styles and needed features.
Can ChatGPT analyse stock market?
ChatGPT can assist with market research, summarizing data, and generating trade ideas, but it cannot analyze the stock market in real-time or integrate with charting platforms for technical analysis.
What is the 3-5-7 rule in stocks?
The 3-5-7 rule is a common investment principle suggesting that, historically, markets may offer average returns of 3% (bonds), 5% (balanced portfolios), and 7% (stocks). It is not a strict rule for analysis tools but can be a guideline for long-term expectations.
What is the best free stock analyzer?
Yahoo Finance and TradingView offer some of the most comprehensive free tools for stock market analysis, including real-time market data, charting, and basic screener capabilities.
Troubleshooting Common Issues in Stock Market Analysis Software
- Data feed interruptions and latency
- Software crashes and compatibility issues
- Difficulties interpreting technical indicators
- Custom indicator coding errors
If your stock market analysis software shows delayed market data, frequent disconnects, or confusing error messages, check your internet stability and consider restarting the app. For platform crashes or indicator issues, updating your software, reviewing documentation, or contacting support can solve many problems. Many platforms also offer forums or community support where developers or experienced users share code fixes for custom indicators or plug-ins—making troubleshooting less daunting over time.

FAQs About Stock Market Analysis Software
- Can stock market analysis software automate my trading strategies?
Yes, many platforms – especially advanced options like Trade Ideas and TrendSpider – can automate trade idea generation, send alerts, or even execute trades based on predefined strategies and technical indicators, subject to broker integration. - How do I secure my data in these platforms?
Use platforms with two-factor authentication, strong data encryption, regular updates, and API compatibility only with trusted trading platforms. - Is technical analysis suitable for beginners?
Absolutely. Many charting tools and platforms offer guided templates, educational resources, and community forums for new users to learn technical analysis step-by-step. - What minimum features should I look for in charting software?
At minimum: Real-time market data, customizable charting tools, technical indicator support, stock screener functionality, and a responsive, user-friendly interface.
Key Takeaways When Choosing Stock Market Analysis Software
- Match software choice to your trading style and goals
- Prioritize technical analysis tools and reliable data
- Test multiple stock analysis platforms for usability
- Consider budget: Free vs. premium features
Conclusion: Unlock Your Trading Potential with the Right Stock Market Analysis Software
Invest in stock market analysis software that aligns with your strategy, and you’ll gain the edge needed to make confident, profitable trades. Choose wisely—and let your software do the heavy lifting, so you can focus on winning the market.


